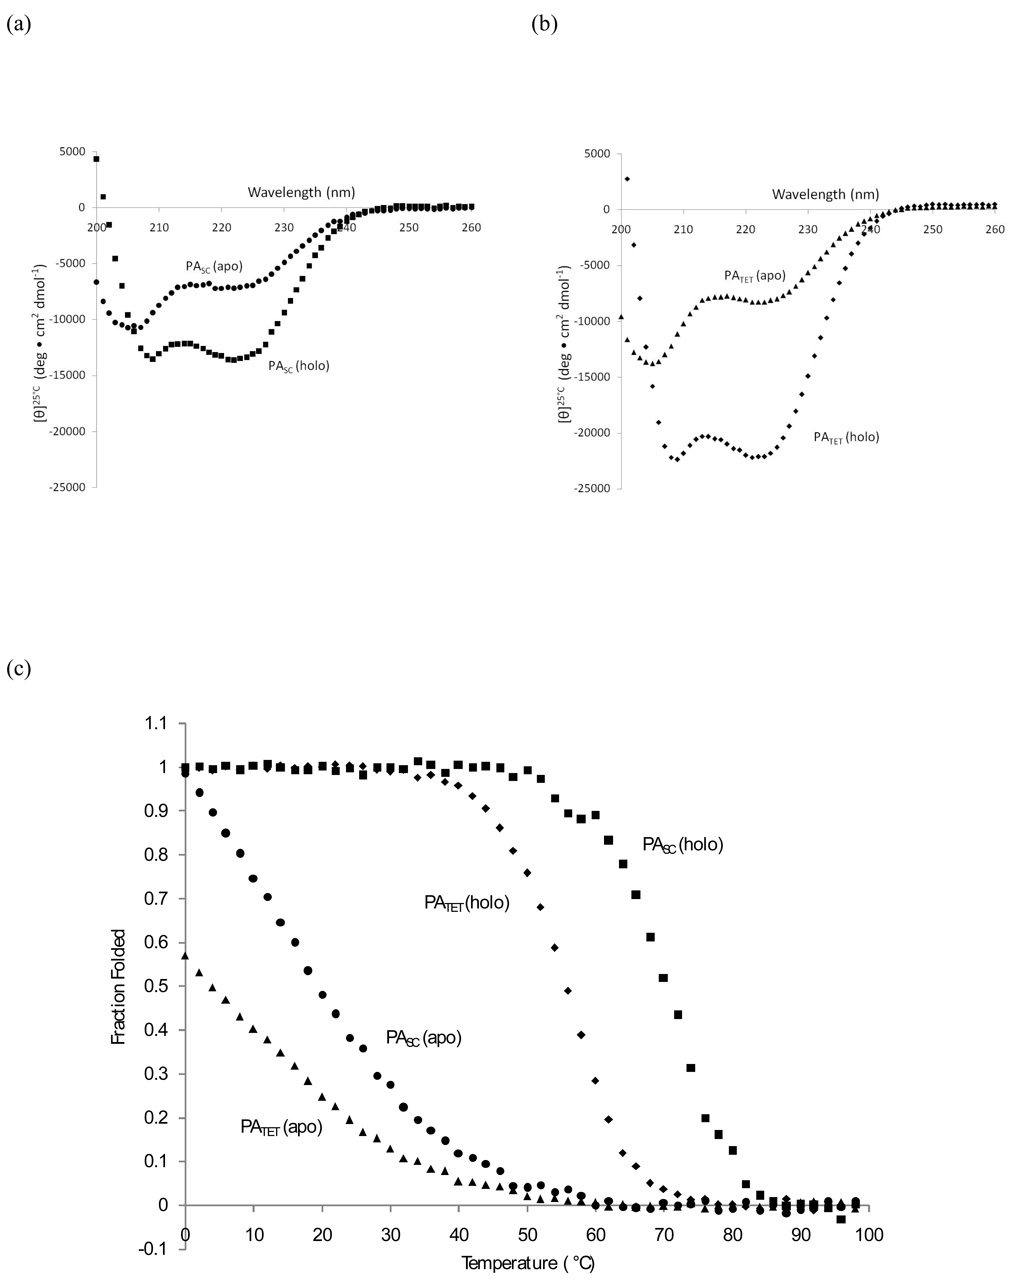
Figure 8.
Circular Dichroism spectroscopy in the near-UV region. (a) The spectra of apo-PASC (25 µM protein, shown in circles) and holo-PASC (25 µM protein + 50 µM FeDPP(III), shown in squares) at 25°C demonstrate the increase in helicity upon addition of FeDPP(III). (b) Spectra of apo-PATET (50 µM protein, shown in triangles) and holo-PATET (50 µM protein + 25 µM FeDPP(III), shown in diamonds). (c) Fraction folded for PATET (apo, holo) and PASC (apo, holo) demonstrate that the Tm’s (°C) for PASC are higher than those for PATET, indicating increased stability.

