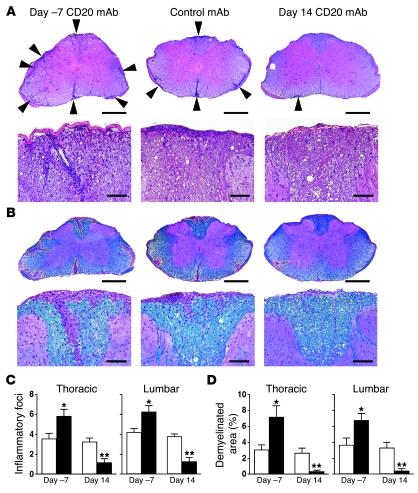
Figure 2. Quantitative EAE histopathology following B cell depletion as in Figure 1.
(A and B) Representative lumbar spinal cord sections harvested 18 days after MOG immunizations (n ≥ 4 mice per group) show (A) inflammation (H&E staining) and (B) demyelination (Luxol Fast Blue staining). Upper panels are low magnification (scale bar: 0.5 mm). Lower panels are high magnification (scale bar: 0.01 mm). (A) Arrowheads indicate inflammatory foci. (B) Yellow traced areas indicate demyelination. (C) Bar graphs indicate (mean ± SEM) numbers of inflammatory foci and (D) demyelinated area, with significant differences between CD20 (black bars) and control mAb–treatments (white bars) indicated; *P < 0.05, **P < 0.005. Similar results were obtained in at least 2 independent experiments.

