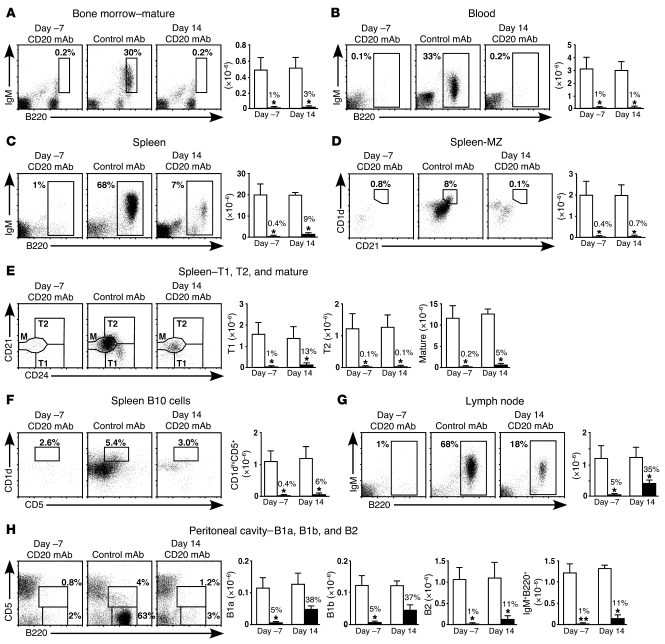
Figure 3. CD20 mAb–induced B cell depletion in EAE mice.
B6 mice were treated with CD20 or control mAb 7 days before or 14 days after MOG immunization. Representative depletion of B cells from the (A) bone marrow, (B) blood, (C–F) spleen, (G) peripheral lymph nodes, and (H) peritoneal cavity 18 days after MOG immunization (n ≥ 4 mice per group) as determined by immunofluorescence staining with flow cytometry analysis. Within in the histograms, numbers indicate relative percentages of lymphocytes within the indicated gates. Bar graphs indicate (mean ± SEM) numbers of blood (per ml) and tissue B cells following mAb treatment. Within the bar graphs, numbers indicate the percentage of B cells of each phenotype found in CD20 mAb–treated mice (black bars) relative to the numbers of B cells found in control mAb–treated littermates (white bars). Significant differences between CD20 versus control mAb–treated mice are indicated; *P < 0.05, **P < 0.01. Data are representative of at least 2 independent experiments. MZ, marginal zone.

