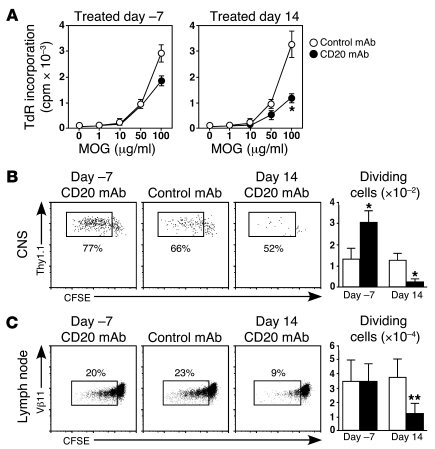
Figure 6. B cells regulate MOG-specific CD4+ T cell expansion.
B6 mice were treated with CD20 or control mAb 7 days before or 14 days after MOG immunizations. (A) Eighteen days after MOG immunizations, CD4+ T cells were purified from superficial lymph nodes and incubated with MOG peptide plus mitomycin C–treated B cells from control mAb–treated EAE mice (n ≥ 3 mice per group). Values indicate (mean ± SEM) [3H]-thymidine (TdR) uptake from triplicate cultures. (B) Seventeen days after MOG immunizations, CFSE-labeled TCRMOG CD4+Thy1.1+ T cells were transferred into Thy1.2 congenic recipients. Four days later, CNS-infiltrating cells were stained for CD4/Thy1.1 expression and analyzed for CFSE dilution by flow cytometry analysis. Representative frequencies of dividing CFSE-labeled cells are shown (gated on CD4+Thy1.1+ cells). (C) Seventeen days after MOG immunizations, CFSE-labeled TCRMOG CD4+ T cells were transferred into mice. Four days later, superficial lymph node cells were stained for Vβ11/CD4 expression and analyzed for CFSE dilution by flow cytometry. Representative frequencies of dividing CFSE-labeled cells are shown (gated on CD4+Vβ11+CFSE+ cells). (B and C) Bar graphs indicate (mean ± SEM) numbers of dividing TCRMOG T cells following CD20 (black bars) or control mAb (white bars) treatments. Numbers indicate percentages of CFSE-labeled CD4+ T cells. (A–C) Significant differences between CD20 versus control mAb treatment are indicated; *P < 0.05, **P < 0.001. Similar results were obtained in at least 2 independent experiments.

