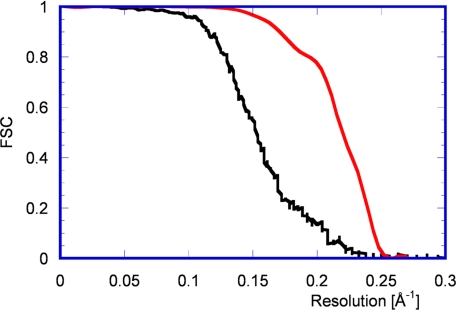
Fig. 4.
FSC curves before (black) and after (red) 13-fold nonicosahedral averaging. The black curve suggests a resolution of 5.1 Å (0.143 threshold value), and the red curve indicates a resolution of 4.1 Å. By using the more conservative threshold of 0.5, the cut-off values are 6.5 Å (black curve) and 4.5 Å (red curve).

