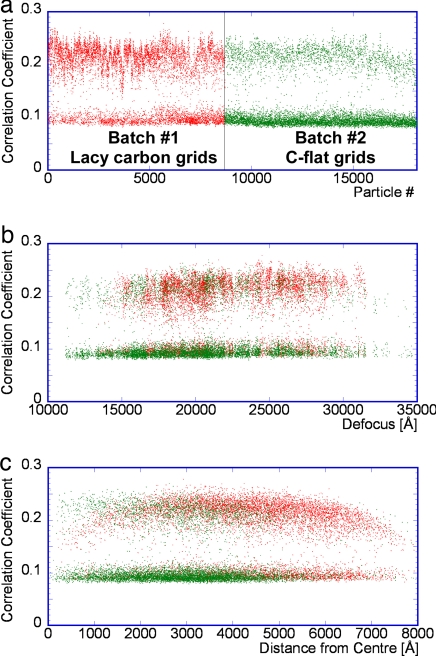
Fig. 5.
Correlation coefficients between images of DLPs and the reference. (a) Correlation coefficients are plotted as a function of particle and batch number (red, lacy carbon; green, C-flat). There is a bimodal distribution with a correlation coefficient of ≈0.14 separating the two clusters. (b) Correlation coefficients are plotted as a function of image defocus. (c) Correlation coefficients are plotted as a function of approximate particle distance from the center of hole in the carbon film.

