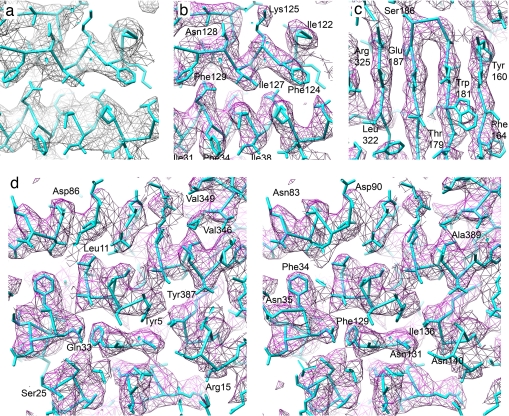
Fig. 6.
Comparison of x-ray crystallographic and EM density maps. (a) X-ray crystallographic, icosahedrally averaged 2Fo − Fc density map at 3.8-Å resolution and atomic model built into this map (B. McLain, E.S., R.B., and S.C.H., unpublished data). The density corresponds to area 2 in Fig. 2c. (b) Same area as in a but showing the cryo-EM map. (c) Cryo-EM density in area 3 (Fig. 2c) showing clearly separated β-sheet strands. (d) Stereo image of area 4 (Fig. 2c) showing amino acid side chains protruding from different α-helices.

