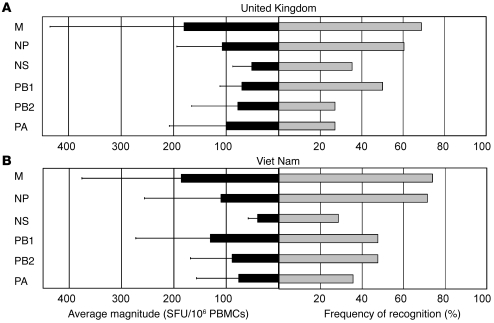
Figure 3. Relative dominance of cross-reactive memory T cell responses to the internal proteins of avian influenza A (H5N1) virus in healthy individuals.
Gray bars represent the percentage of participants from the UK (A) and Viet Nam (B) who exhibited a detectable IFN-γ T cell response to at least one peptide pool corresponding to the specified source protein on ex vivo IFN-γ ELISpot assay. The average magnitude of IFN-γ T cell responses directed to each protein is represented by black bars. Data are mean ± SD. UK, n = 48; Viet Nam, n = 42.

