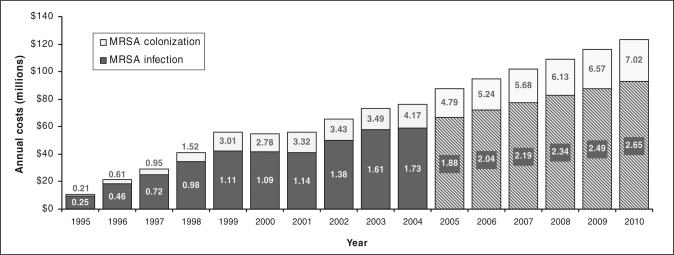
Figure 2.
Estimated annual cost of methicillin-resistant Staphylococcus aureus (MRSA) infection and colonization in Canada – 1995 to 2010. Numbers in graph indicate incidence of MRSA (rate per 1000 admissions); hatched bars indicate projected annual costs based on historical data. Costs based on the Canadian dollar in 2005

