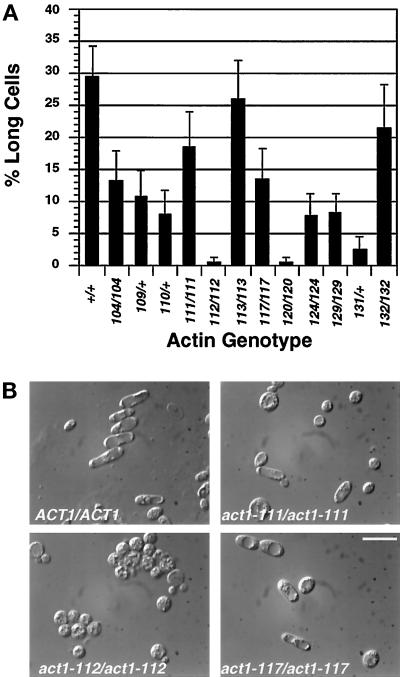
Figure 2.
Effect of act1 mutations on cell elongation. (A) Percentage of long cells in each of the actin mutants. Complete genotypes of strains are as indicated in Figure 1. Long cell counts were performed as described in MATERIALS AND METHODS. Bars show the SE of two independent experiments. (B) Examples of different cell elongation phenotypes. Images shown are differential interference contrast images of cells scraped from the agar as above. Bar, 10 μm.

