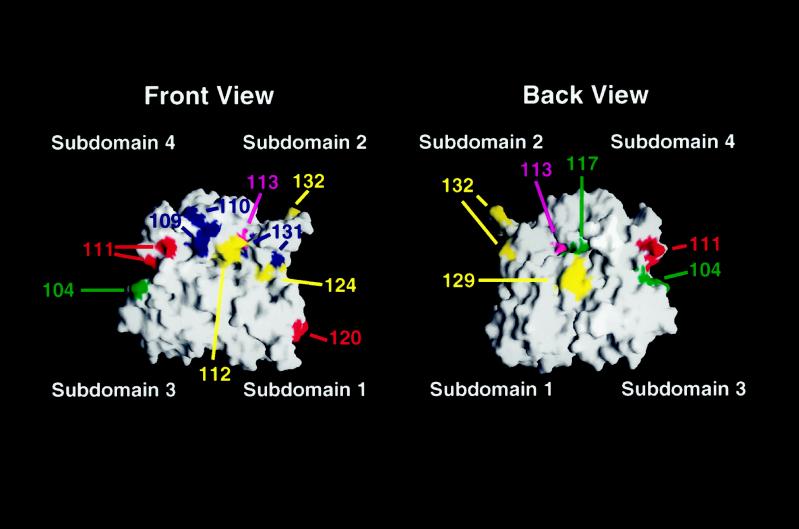
Figure 8.
Modeling of the mutations analyzed in this study onto the solvent-exposed surface of an actin monomer. Shown is the calculated surface of the actin monomer based on the coordinates of the rabbit muscle actin filament structure (Lorenz et al., 1993). Actin subdomains are indicated. Red, locations of residues altered by viable, temperature-sensitive alleles with recessive effects on PH growth; yellow, location of residues altered by viable, temperature-sensitive alleles with dominant effects on PH growth; blue, positions of residues affected by recessive lethal alleles with dominant effects on PH growth; green, locations of residues affected by mutations that have no effect on viability but disrupt PH growth; magenta, positions of residues altered by mutations with no effect on PH growth. Surfaces were generated using GRASP (Nicholls et al., 1991) on a Silicon Graphics Iris computer.

