
Figure 3.
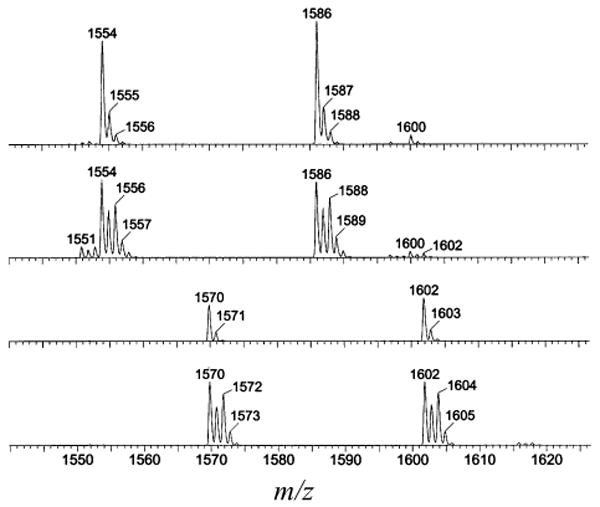
Selected region of ESI mass spectra of 3, 3(17,18O), 4, and 4(17,18O) (top to bottom, respectively). Additional peak intensities are shown at (m + 1)/z and (m + 2)/z in spectra of isotopically labeled samples.
Official websites use .gov
A
.gov website belongs to an official
government organization in the United States.
Secure .gov websites use HTTPS
A lock (
) or https:// means you've safely
connected to the .gov website. Share sensitive
information only on official, secure websites.
Selected region of ESI mass spectra of 3, 3(17,18O), 4, and 4(17,18O) (top to bottom, respectively). Additional peak intensities are shown at (m + 1)/z and (m + 2)/z in spectra of isotopically labeled samples.