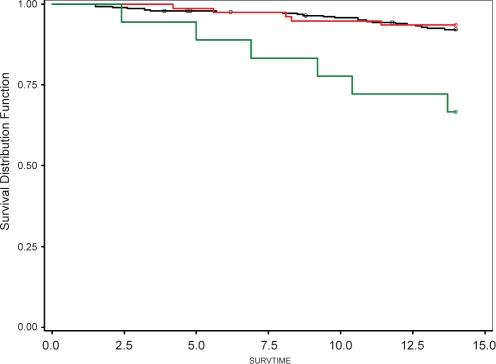
Figure 1.
Green line indicates the survival distribution for participants with moderate-severe sleep apnea (RDI ≥15), the Red line those with mild sleep apnea (RDI 5–14) and the Black line those with no sleep apnea (RDI <5). Circles indicate censored observations. The visually apparent difference between the Green line and the Black line is statistically significant (P < 0.001, see also Table 2 and Table 3 for multivariate confirmation).

