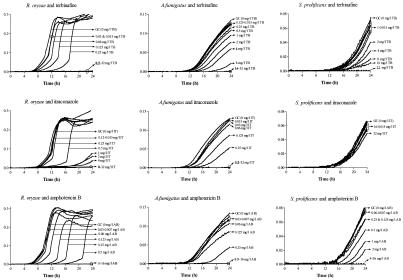
FIG. 1.
Growth curves of an R. oryzae, A. fumigatus, and S. prolificans strains in the presence of twofold-increasing concentrations of TB, IT, and AB, including those in the drug-free growth controls (GC) indicated by arrows. ODs were normalized for each growth curve by subtracting the background OD at each time point (y axes show optical densities at 450 nm). The bold and underlined drug concentrations correspond to MIC-0 and MIC-2, respectively. ICZ, itraconazole.

