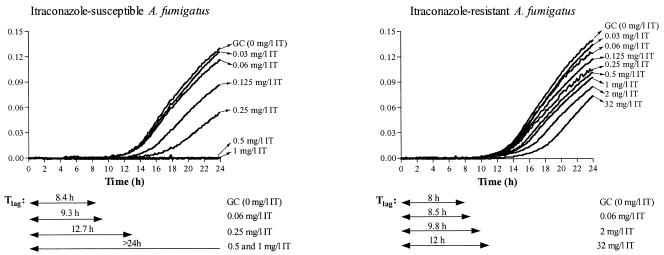
FIG. 2.
Growth curves of IT-susceptible and -resistant A. fumigatus strains in the presence of increasing concentrations of IT. ODs were normalized for each growth curve by subtracting the background OD at each time point. The Tlags for the growth control (GC) and some drug concentrations are presented. The MIC-2 after 48 h of incubation was 0.25 mg/liter for the susceptible strain and >32 mg/liter for the resistant strain. ICZ, itraconazole.

