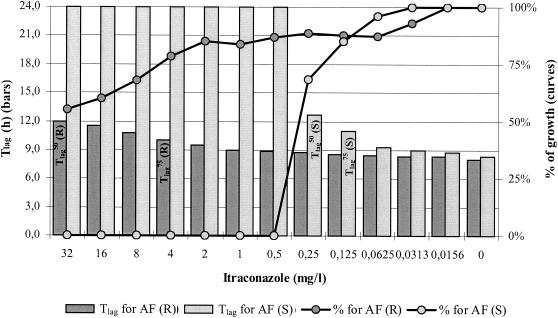
FIG. 3.
Graphical representation of the correlation between Tlag (bars) and percentages of growth (curves) after 48 h of incubation for IT-susceptible [AF (S)] (light gray) and -resistant [AF (R)] (dark gray) A. fumigatus strains for which the MIC-2s were 0.5 and >32 mg/liter, respectively. Note that while Tlags increased with increasing drug concentrations, the percentages of growth decreased. For the resistant strain, the Tlags at any drug concentration did not exceed 12 h and were within a 4-h difference compared with the Tlag of growth control (8 h). The Tlag endpoints are also shown inside the corresponding bars for the IT-susceptible [AF (S)] and -resistant [AF (R)] A. fumigatus strains.

