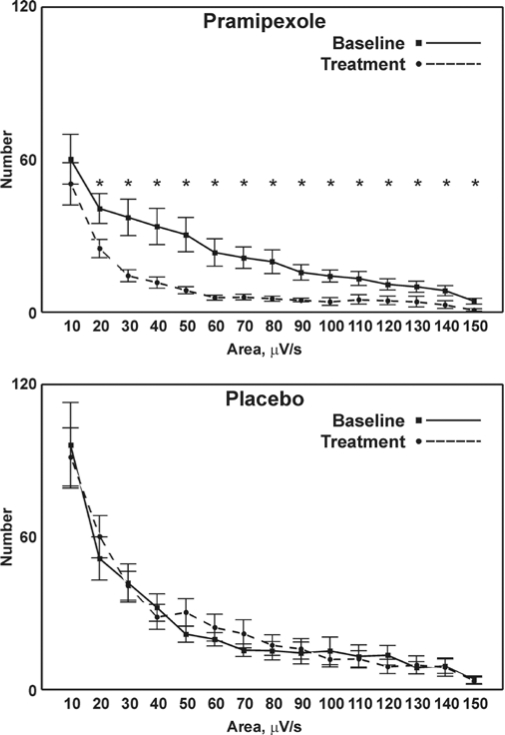
Figure 3.
Comparison between the distribution of LM area-under-curve before (baseline) and after treatment with pramipexole (top panel) or placebo (bottom panel); values are shown as mean and SEM (whiskers). Asterisks indicate the points for which a significant difference was found between the graphs in each panel at statistical analysis (Student t-test followed by the Bonferroni correction for 15 comparisons; P < 0.00333*15 = P < 0.05).

