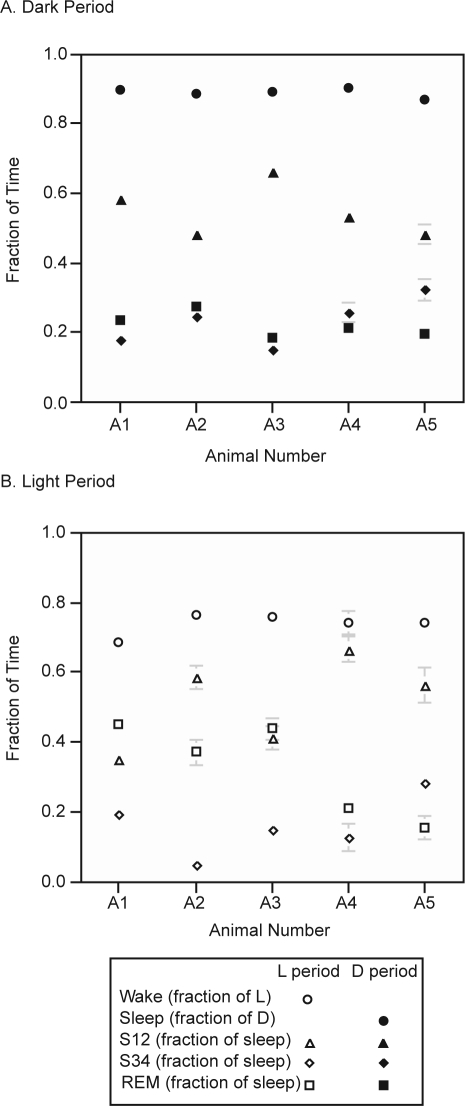
Figure 2.
Nighttime (A, filled markers) and daytime (B, open markers) distribution of sleep stages showing variability among individual animals. S12: time in stage S12 vs. total sleep time; REM: time in stage REM vs. total sleep time; S34: time in stage S34 vs. total sleep time; Sleep: total sleep time in dark period; Wake: total wake time in light period. Error bars = SEM. The sleep stage ratios vary from animal to animal, but the total time asleep is similar among animals in both dark and light periods.

