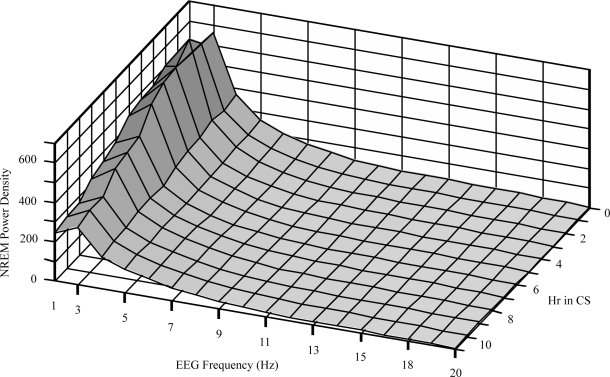
Figure 8.
Power density spectrum of NREM EEG from 0.3 to 20 Hz shown by elapsed hour within the CS period. Spectra were obtained from 5 animals over 6 nights. EEG frequencies (in Hz) shown represent the upper bin limits beginning with 0.3 to 1 Hz (labeled 1 Hz), 1 to 2 Hz, and so on. The lowest EEG frequencies show major changes as CS progresses.

