
Figure 3.
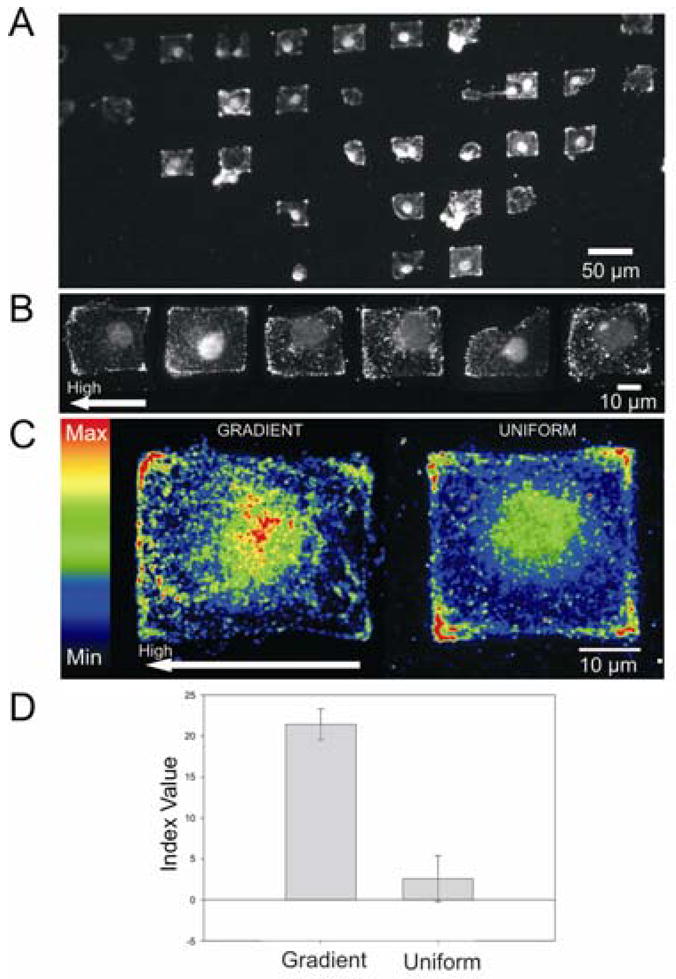
Representative views of B16/F10 melanoma cells stained for vinculin. (A) Fluorescent image of fixed and immunostained cells on an array of gradient microislands. (B) Representative images of single cells isolated on gradient islands. (C) Representative heat maps of cells on gradient (left) and uniform (right) microislands. High RGD concentration is located on the left side of the gradient heat map. The total area of the islands is ~1000 μm2 (gradient, n=22; uniform, n=11). (D) Average index values for four separate experiments. Error bars represent the standard error of measurement.