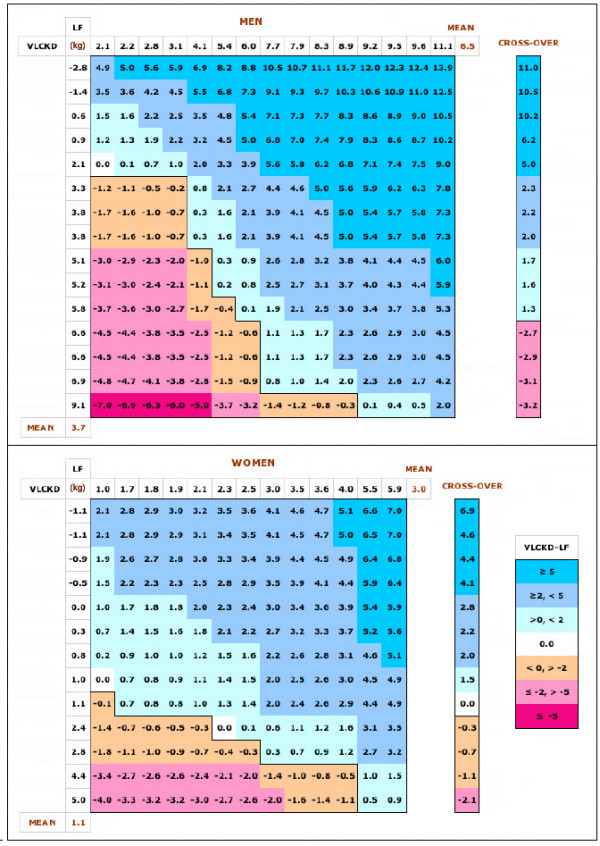
Figure 1.

Payoff matrix for dietary comparisons. Matrices show (theoretical) paired comparisons: Weight loss (in kg) for each individual in the VLCKD is shown in rank order across the top of the matrix (X-axis). Weight loss for the LF is shown down the side of the matrix (X-axis). Each matrix element shows the difference between the value for the VLCKD (column) and the value for the LF (row):VLCKD-LF. Positive values indicate more weight loss for the VLCKD value than the LF, negative values indicate the reverse. Data are from reference [3] in which subjects were assigned to two diets with roughly similar caloric levels (VLCKD: 1855 kcal/d; LF: 1550 kcal/d) differing in nutrient composition: VLCKD = %carbohydrate:fat:protein = ~9:63:28, LF, ~58:22:20. After a fixed period (50 days for men; 30 days for women) subjects switched to the other diet. Data in the matrices are for performance in each phase. In the cross-over data, weight loss for each subject from the LF phase is subtracted from weight loss in the VLCKD phase (regardless of which came first in the experiment) and displayed in rank order. Color-coding as indicated in the figure.
