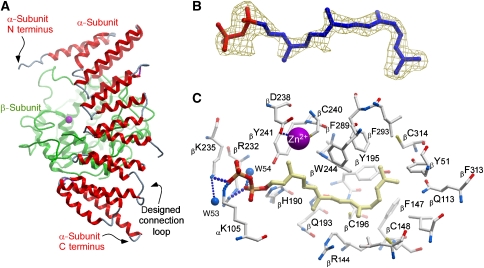
Figure 2.
Structure of the RabGGTaseΔLLRΔIg variant in the apo form and in complex with GGPP. (A) Structure of the apo form in ribbon representation. The β-subunit is coloured green, whereas the α-subunit is coloured by secondary structure. (B) Density map of the active centre of the RabGGTaseΔLLRΔIg–GGPP complex contoured 2.5 σ The electron density (Fo−Fc map) was calculated prior to the incorporation of the ligand into the model. (C) Ball and stick representation of the active site of RabGGTaseΔLLRΔIg with a bound GGPP molecule. The hydrogen bonds are shown as strings of small blue balls sized according to distance. The Zn2+ ion is shown as a magenta ball.

