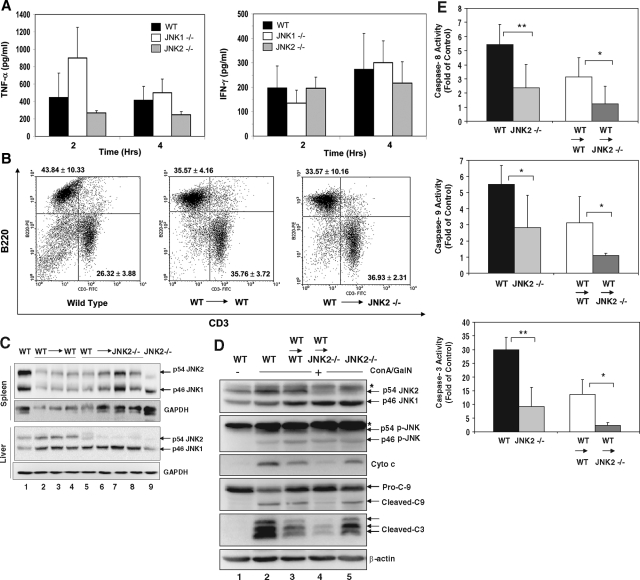
Figure 5.
JNK2-deficient (JNK2−/−) livers are protected from ConA/GalN-induced apoptosis. A: WT (black columns), JNK1−/− (white columns), and JNK2−/− (gray columns) mice were treated with ConA/GalN and sacrificed at the designated time point. Serum levels of TNF-α and IFN-γ were determined. Data (mean ± SD) are from at least three mice for each group at the indicated time points. There are no statistical differences between WT and the JNK1 or JNK2-deficient mice. B: Splenocytes recovered from normal WT mice (left panel, n = 4), or WT mice reconstituted with WT bone marrow (WT → WT, middle panel, n = 4), or JNK2−/− mice reconstituted with WT bone marrow (WT → JNK2−/−, right panel, n = 5) were analyzed by flow cytometry using fluorescein isothiocyanate-anti-CD3 and PE-anti-B220. The percentages (mean ± SD) of B220-positive cells (B cells) and CD3-positive cells (T cells) are indicated at the upper left quadrant, and lower right quadrant, respectively. C: Spleen lysates and liver cytosols from the above mice, and JNK2-deficient (JNK2−/−) mice were analyzed by immunoblot assay with antibodies against total JNK and GAPDH. Each lane represents one mouse sample. D: Liver cytosols from the same group of mice as in C after 8 hours of ConA/GalN treatment were subjected to immunoblot assay with the indicated antibodies. Asterisks indicated non-specific bands. Note the differences between lanes 2 and 5, and between lanes 3 and 4. E: The liver cytosolic fractions from ConA/GalN-treated mice were analyzed for caspase-8, -9, and -3 activities (WT n = 7, JNK2−/− n = 7, WT → WT n = 8, WT → JNK2−/− n = 9). Results (mean ± SD) are expressed as fold of the changes over the untreated controls. Groups that had significantly different responses are indicated (*P < 0.05; **P < 0.01).

