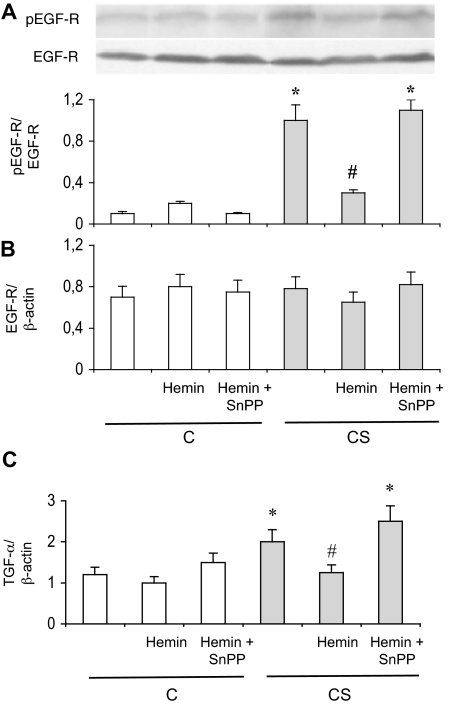
Figure 3.
EGF pathway in rat epithelium. A: Typical Western blot showing detection of phosphorylated (pEGF-R, Tyr845) and nonphosphorylated EGF-R expression. The bottom part shows densitometric analysis of pEGF-R expression as a ratio of EGF-R expression. Abbreviations are the same as those in Figure 1. Values are mean ± SEM, n = 10 to 12 in each group. *P < 0.05 versus vehicle-treated C; #P < 0.05 versus vehicle-treated CS. B: Real-time RT-PCR analysis of EGF-R mRNA expression as a ratio of β-actin mRNA level. Abbreviations are the same as those in Figure 1. Values are mean ± SEM, n = 12 to 15 in each group. C: Real-time RT-PCR analysis of TGF-α mRNA expression as a ratio of β-actin mRNA level. Abbreviations are the same as those in Figure 1. Values are mean ± SEM, n = 12 to 15 in each group. *P < 0.05 versus vehicle-treated C; #P < 0.05 versus vehicle-treated CS.

