Figure 5.
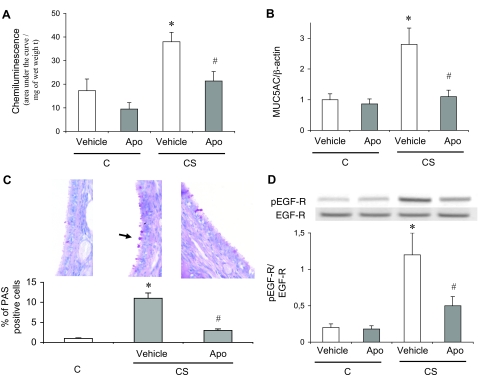
Effects of apocynin treatment in rats exposed or not to cigarette smoke. A: Reactive oxygen species production in tracheal rings evaluated by chemiluminescence. Values are expressed as the total chemiluminescence produced (cpm) throughout 60 minutes, normalized to the wet weight of the ring. C, Animals exposed to room air; CS, animals exposed to cigarette smoke; Apo, apocynin. Values are mean ± SEM, n = 10 to 12 in each group. *P < 0.05 versus vehicle-treated C; #P < 0.05 versus vehicle-treated CS. B: Real-time RT-PCR analysis of MUC5AC expression expressed as a ratio of β-actin mRNA level. Abbreviations are the same as those in A. Values are mean ± SEM, n = 10 to 12 in each group. *P < 0.05 versus vehicle-treated C; #P < 0.05 versus vehicle-treated CS. C: PAS staining in trachea. PAS(+) cells are stained in red. The arrow shows a PAS(+) cell. The bottom part shows the percentage of PAS(+) cells over the whole number of epithelial cells. Abbreviations are the same as those in A. Values are mean ± SEM, n = 10 to 12 in each group. *P < 0.05 versus vehicle-treated C; #P < 0.05 versus vehicle-treated CS. D: Typical Western blot showing detection of phosphorylated (pEGF-R, Tyr845) and nonphosphorylated EGF-R expression. The bottom part shows densitometric analysis of pEGF-R expression expressed as a ratio of EGF-R expression. Abbreviations are the same as those in A. Values are mean ± SEM, n = 10 to 12 in each group. *P < 0.05 versus vehicle-treated C; #P < 0.05 versus vehicle-treated CS. Original magnifications, ×40.

