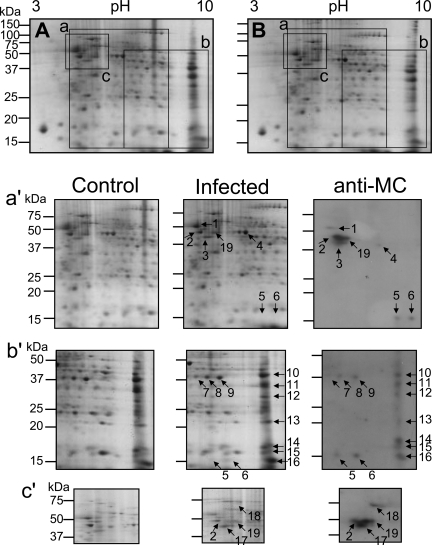
Figure 7.
Detection of citrullinated proteins from two-dimensional electrophoresis. The 2-DE gels show CBBG-250 staining of proteins from brains of control and infected mice (A and B, respectively). The rectangular areas (a–c) of the 2-DE gels represent a part of the 2-DE gels in each region of control and infected brains (left and middle, respectively) and citrullinated proteins (anti-MC) assayed by Western blot (right) from whole brain (a′), cerebellum (b′), brain stem (c′). Serial numbers in each infected region were used to distinguish between the identified citrullinated proteins in each region. The second spot in whole brain was the same as the one in brain stem, the fifth and sixth spots in whole brain were equal to the spots in cerebellum. The 19th spot was also detected in hippocampus (data not shown). Each experiment was repeated at least three times, and similar results were obtained.

