Figure 3.
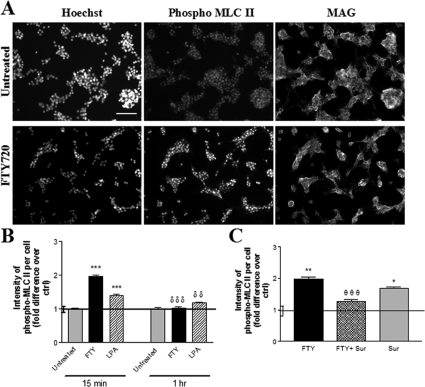
Fingolimod-induced activation of a cytoskeletal modulator in mature OLGs indicative of functional signaling downstream of S1P receptors. A: Representative images of untreated (top) and fingolimod-phosphate-treated (FTY, 1 μmol/L; bottom) mature OLG cultures immunostained for the nuclear stain Hoechst (left), phospho-myosin light chain (MLC) II (middle), and MAG, demonstrate that at 15 minutes of treatment fingolimod-phosphate increases the intensity of phospho-MLC II staining in OLGs relative to control. B: Quantification of phospho-MLC II staining intensity per cell normalized to untreated control at the respective time point. fingolimod-phosphate (1 μmol/L) and the positive control LPA induce a significant increase in phospho-MLC II staining intensity at 15 minutes, with an expected drop at a later time point (1 hour). ***P < 0.001 relative to control; δδδP < 0.001 relative to previous time point; δδP < 0.01 relative to previous time point. C: The fingolimod-induced increase in intensity of phospho-MLC II staining per cell at 15 minutes was negated by co-treatment with the S1P3/5 pathway antagonist, suramin (sur, 100 nmol/L), whereas the increase in intensity was still observed when suramin was applied alone. *P < 0.05, **P < 0.01 relative to control; θθθP < 0.001 relative to fingolimod-phosphate alone.

