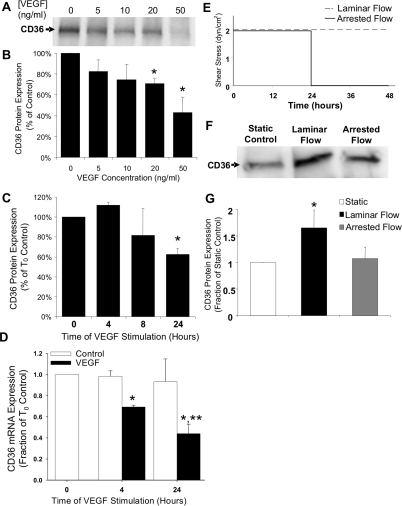
Figure 4.
Endothelial CD36 expression is regulated by VEGF and shear stress. A: Western blot for CD36 expression in HUVECs 24 hours after VEGF treatment. B: Bar graph of densitometric analysis of CD36 expression throughout a range of VEGF concentrations. *Significantly different from 0 ng/ml (P < 0.05) by one-way analysis of variance and Tukey’s t-test. C: Bar graph of densitometric analysis of CD36 expression throughout a range of VEGF application times. *Significantly different from 0 hours (P < 0.05) by one-way analysis of variance and Tukey’s t-test. D: Bar graph of CD36 mRNA expression by RT-PCR. Data are normalized to the β2-microglobulin (B2M) housekeeping gene and then to control cells at 0 hours. *Significantly different from T0 control (P < 0.05) by Student’s t-test. *,**Significantly different from time-matched control (P < 0.05) by two-way analysis of variance and Tukey’s t-test. E: Experimental protocol for shear stress experiments. Quiescent capillary conditions were simulated by 48 hours of flow at 2 dynes/cm2, whereas sprout conditions were simulated by 24 hours of flow followed by 24 hours of static conditions. F: Western blot for CD36 expression in HUVECs exposed to static, laminar flow, and arrested flow conditions. G: Bar graph of CD36 expression in HUVECs exposed to static, steady flow, and arrested flow conditions. *Significantly different (P < 0.05) than static and arrested flow groups by Student’s t-test. All values are means ± SD.

