
Figure 4.
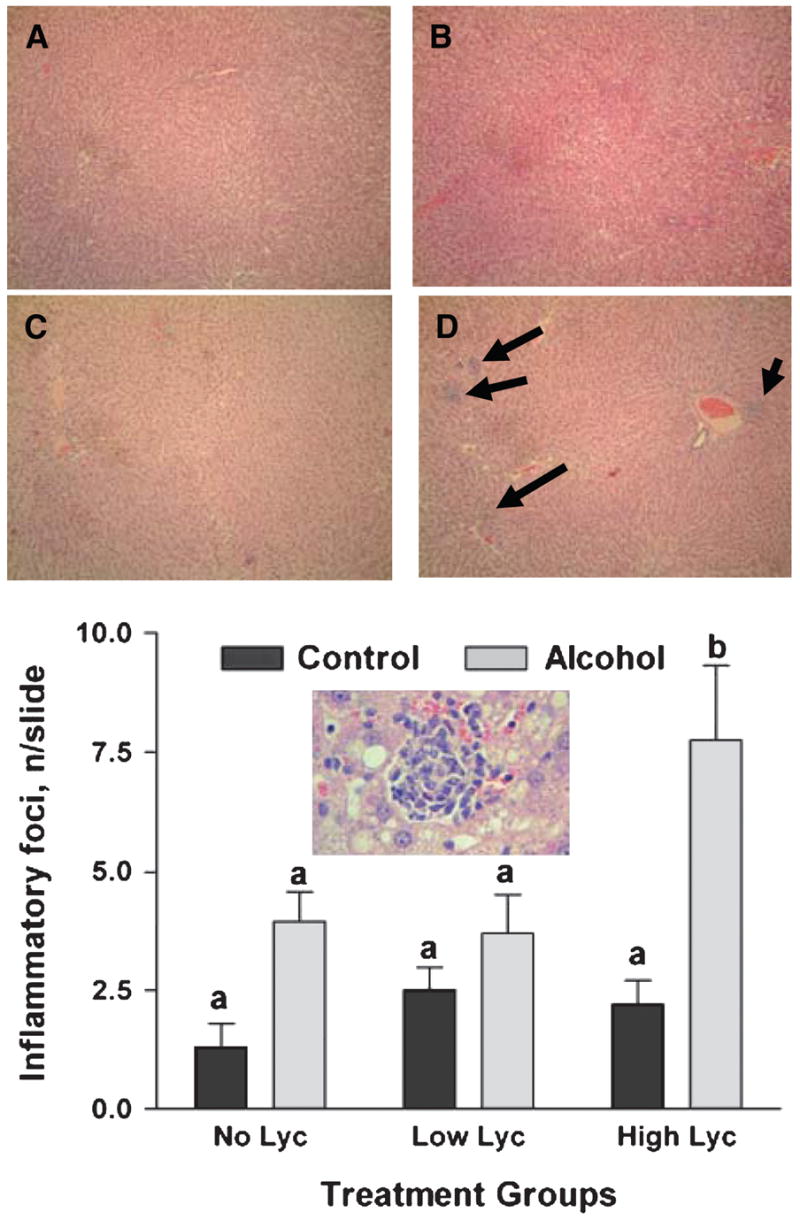
Incidence of inflammatory foci in the livers of rats after 11 wk of feeding either control or alcohol diets with or without lycopene (Lyc) supplementation. Values are means ± SEM, n = 10. Bars without a common letter differ, P < 0.05. Upper panel: Representative image of hepatic inflammatory foci (arrows) from the control (A), control + high lycopene (B), alcohol (C), and alcohol + high dose lycopene group (D) at 10× magnification and 40× magnification (inset).