
Figure 4.
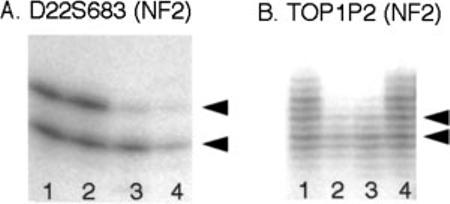
Autoradiography showing LOH at the NF2 gene locus in ocular lesions. Representative retinal hamartomas showing LOH for both markers D22S683 (A) and TOP1P2 (B). Arrowheads point to the position of the respective alleles. ‘Duplication bands’ are seen associated with the dinucleotide repeat marker TOP1P2 (B). (A: lanes 1 and 2, normal retina; lane 3, retinal hamartoma; lane 4, optic nerve neurofibroma. B: lanes 1 and 4, normal retina; lanes 2 and 3, two different retinal hamartomas)