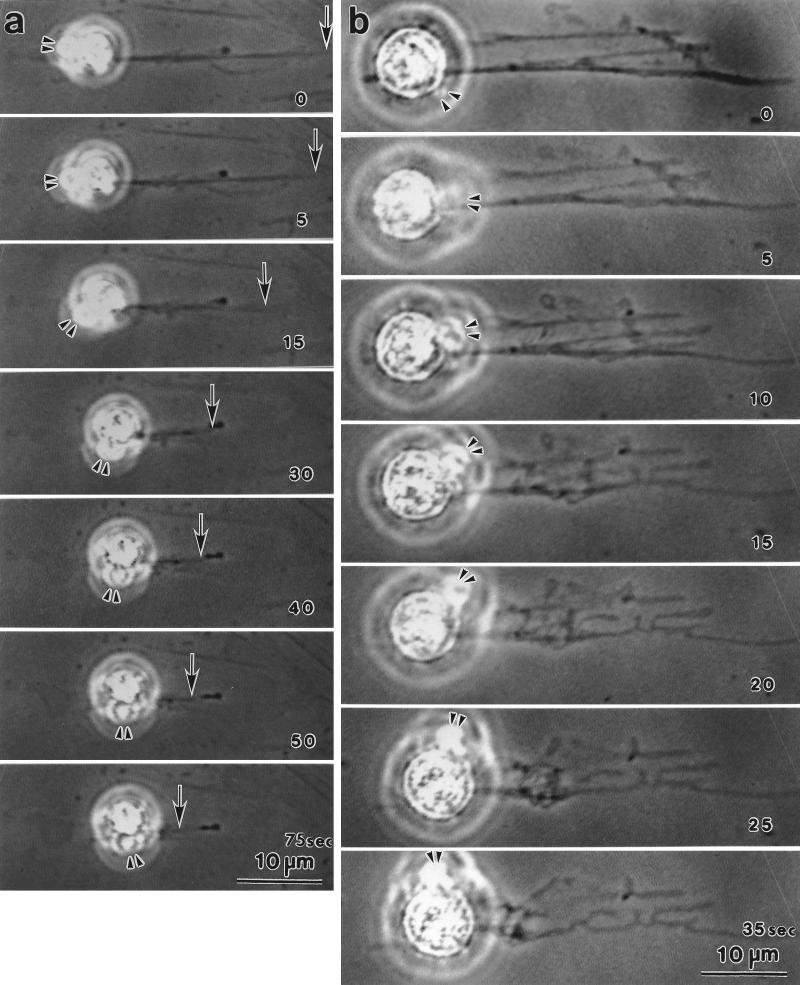
Figure 12.
Rotation of microbeads during contraction of stress fibers. Microbeads were attached to isolated stress fibers to analyze the motion of shortening stress fibers. These video-enhanced phase-contrast images are from time-lapse recording using a disk recorder. The number at the right bottom corner in each plate is time in seconds after Mg-ATP addition. Microbeads attached to the vicinity of one end of isolated stress fibers were selected for observation. Two examples are shown (a and b). The double arrowheads (a and b) indicate the same position on the bead clusters. The number in each panel indicates time in seconds after Mg-ATP addition.

