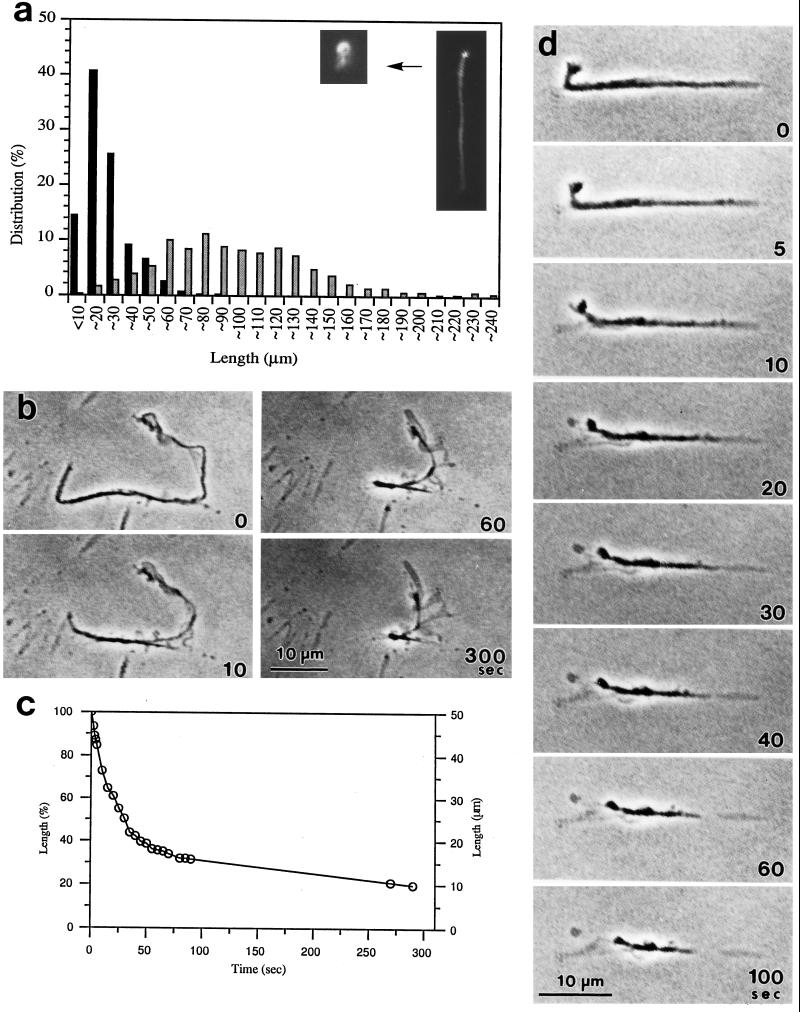
Figure 6.
Shortening of free-floating and attached stress fibers. Length distribution (percent) of free-floating isolated stress fibers before (shaded bars) and 10 min after (black bars) the addition of Mg-ATP were plotted (a). Length measurements were done using stress fibers fixed and stained with rhodamine-labeled phalloidin. The total number of isolated stress fibers counted for each type is 500. A typical example of free-floating isolated stress fiber either before or after shortening is shown in the inset (a). Isolated stress fibers still attached to glass surface were treated with Mg-ATP (b and d). The number in each frame indicates time in seconds after the addition of Mg-ATP solution. Note that the thickness of stress fibers decreases as they shorten. Note also some material left behind shortening stress fibers. The length change (expressed in percent of the initial length and also in actual length) of the stress fiber shown in b is plotted against time in c. The initial maximum speed of shortening was 2.4 μm/s, and the degree of shortening was 80% after 5 min.

