
Figure 3. Proliferation of EPRO-ic/ic cells is inhibited by the loss of LBR expression.
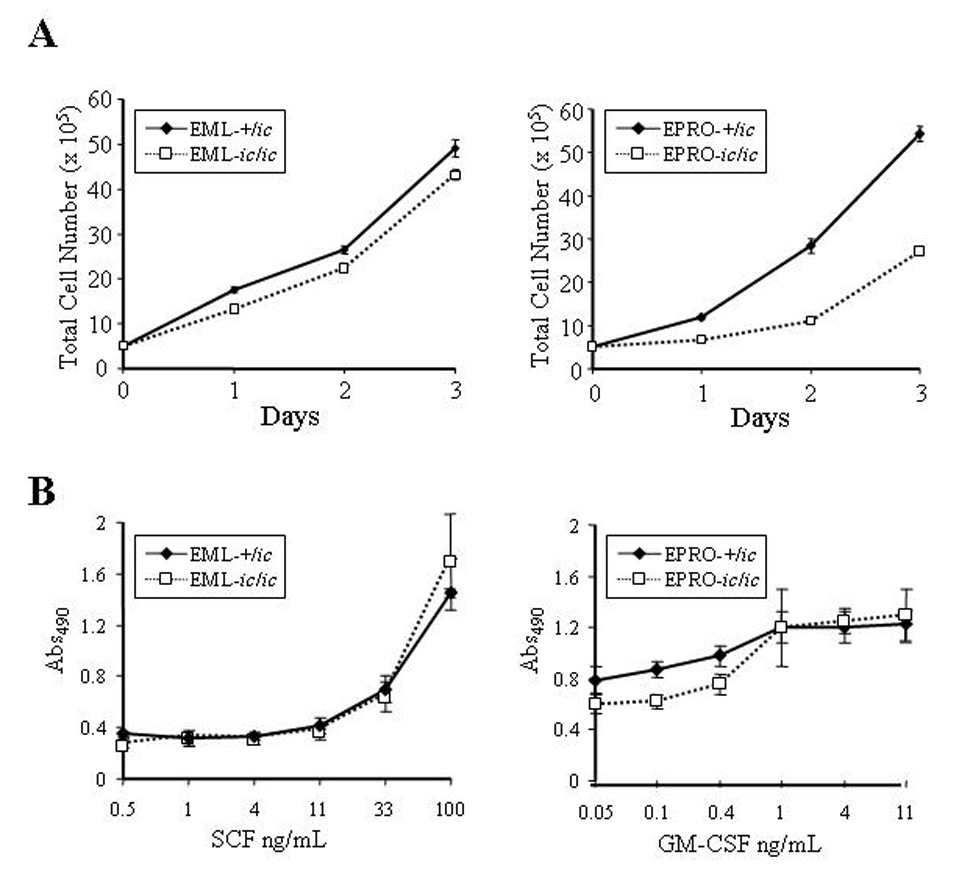
(A) Expansion of viable cells was assessed by visual inspection using trypan blue exclusion. Cells of each genotype were initiated at 1 × 10⁵ cells/mL in EML (left panel) or EPRO (right panel) growth medium, for a total of 5 × 10⁵ cells at day 0. Increases in absolute cell numbers were then determined at 24 hour intervals. Data shown are from 3 independent assays ± SD. P values for growth of EML-+/ic vs. −ic/ic cells are: Day 1, p = 0.0003; Day 2, p = 0.006; Day 3, p = 0.012. P values for EPRO+/ic vs. −ic/ic cells are: Day 1, p = 0.001; Day 2, p < 0.0001; Day 3, p < 0.0001. (B) Proliferation responses to increasing concentrations of cytokines were examined using MTS reduction reagent and absorbances were measured. Each cell type was diluted to equivalent starting concentrations (1 × 10⁵ cells/mL) and increasing concentrations of rmSCF (left panel) or rmGM-CSF (right panel) were used to stimulate growth of EML and EPRO cells, respectively. Shown are data from 3 independent assays ± SD. Differences in responses of EPRO-+/ic vs. −ic/ic to concentrations of GM-CSF below 1 ng/mL were statistically significant (p < 0.0005).