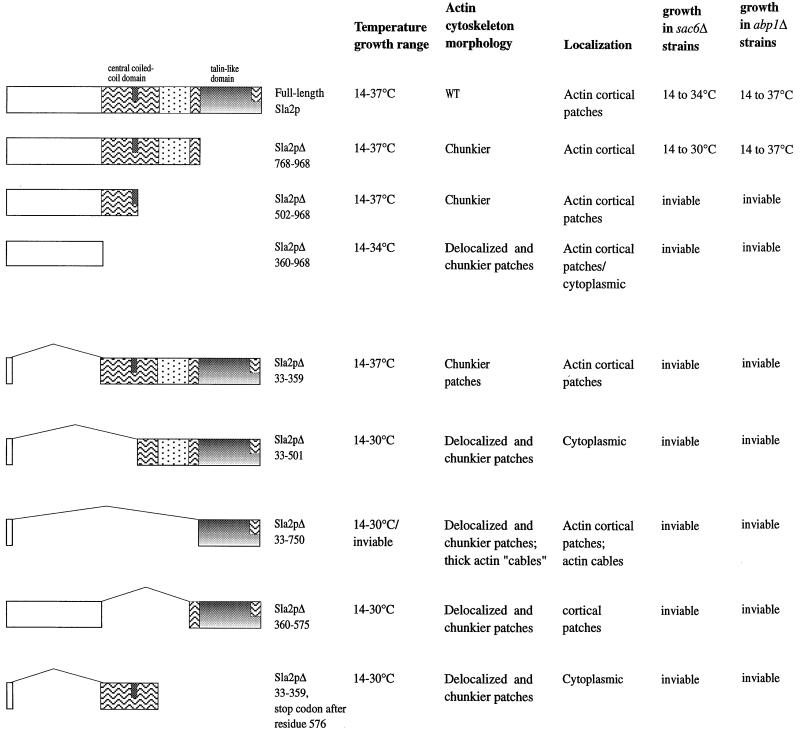
Figure 5.
Sla2p domain analysis summary. The phenotypes of the Sla2p C-terminal truncation and N-terminal deletion mutants are summarized. The schematics indicate the regions of Sla2p expressed in each case and reflect the domain arrangement shown in Figure 1A. The phenotypic analysis was performed in sla2Δ cells expressing the different Sla2p mutants, from either a genomic copy (the three C-terminal mutants were integrated into the genome) or from a high- or low-copy-number plasmid (the five N-terminal deletion mutants).

