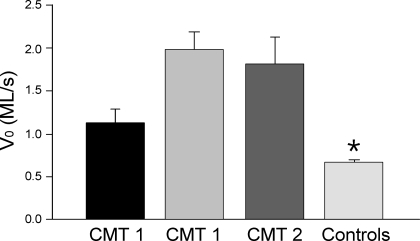
Fig. 4.
Increased maximum velocity of unloaded shortening (V0) in CMT1 and CMT2 fibers. V0 values of skinned muscle fibers were higher in both CMT1 (n = 34) and CMT2 (n = 19) patients compared with control fibers (n = 54) as analyzed by ANOVA on ranks (*P < 0.001). Data are presented as means ± SE. Although there was a trend of difference between the two CMT1 patients, no statistical difference was established. All fibers analyzed were MHC-I fibers. ML, muscle lengths.

