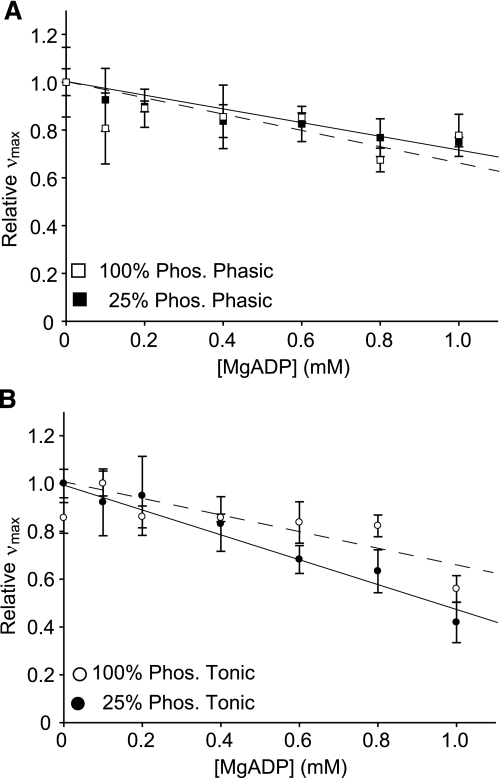
Fig. 7.
Relative νmax (normalized to νmax at 0 mM MgADP) at increasing concentrations of MgADP at 100% and 25% phosphorylation for phasic (A) and tonic smooth muscle myosin (B). The slopes of the regression lines were not significantly different between 100% and 25% phosphorylation for phasic muscle myosin but were significantly different for tonic muscle myosin (P > 0.001).

