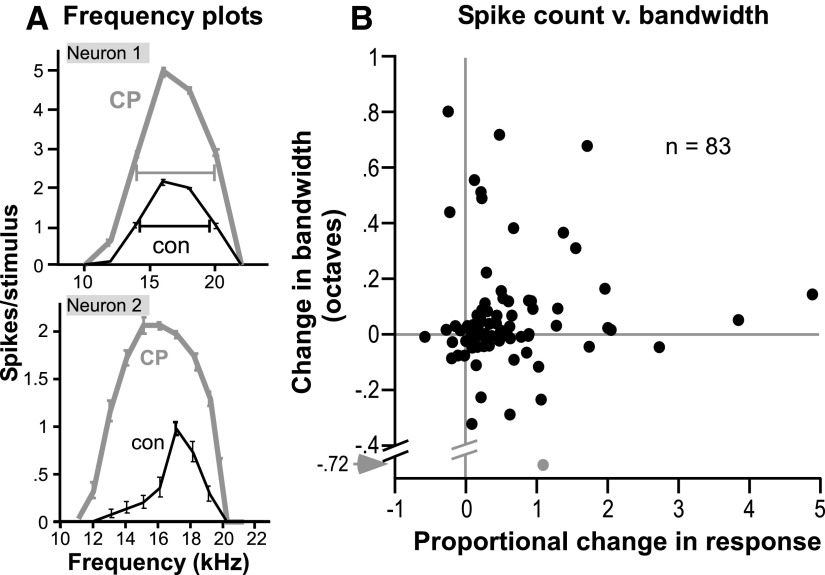
FIG. 2.
Effect of the selective 5-HT1B agonist CP93129 on frequency tuning. A: isointensity plots of average spike count per stimulus (±SE) vs. frequency for 2 individual neurons. For the upper neuron, tones were presented every 2 kHz from 10 to 22 kHz at 50 dB SPL. For the lower neuron, tones were presented every 1 kHz from 11–21 kHz at 40 dB SPL. B: scatterplot of CP93129-evoked changes in spike count vs. tuning bandwidth in a group of 83 neurons. Proportional changes in spike count are the difference between the drug and control counts, normalized to the control value [(CP93129-control)/control], and bandwidth is presented as the difference in octaves between drug and control bandwidths (CP93129-control). Gray lines mark no change along each axis. Gray point represents an extreme value.

