
FIG. 3.
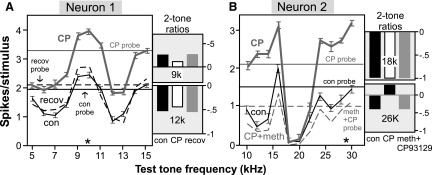
Effect of the selective 5-HT1B agonist CP93129 on 2-tone frequency interactions in two neurons that showed little change in tuning bandwidth. Data for both neurons is presented as the average spike count per stimulus (±SE) in response to the co-presentation of the 2 tones, plotted vs. the frequency of the variable test tone. *, frequency of the excitatory probe tone; —, the response to the probe tone alone at the control, drug application, and recovery. Plots of 2-tone ratio adjacent to the 2-tone plots were calculated by normalizing spike counts in response to both tone stimuli together relative to spike counts evoked by the excitatory probe tone alone ((both tones − probe tone)/ probe tone) for the individual test frequencies indicated. A: for neuron 1, the probe tone was presented at 10 kHz and 50 dB SPL and the test tone was presented every kHz from 5 to 15 kHz at 70 dB SPL. B: for neuron 2, the probe tone was presented at 29 kHz and 40 dB SPL, and the test tone was presented every 2 kHz from 10 to 30 kHz at 60 dB SPL.