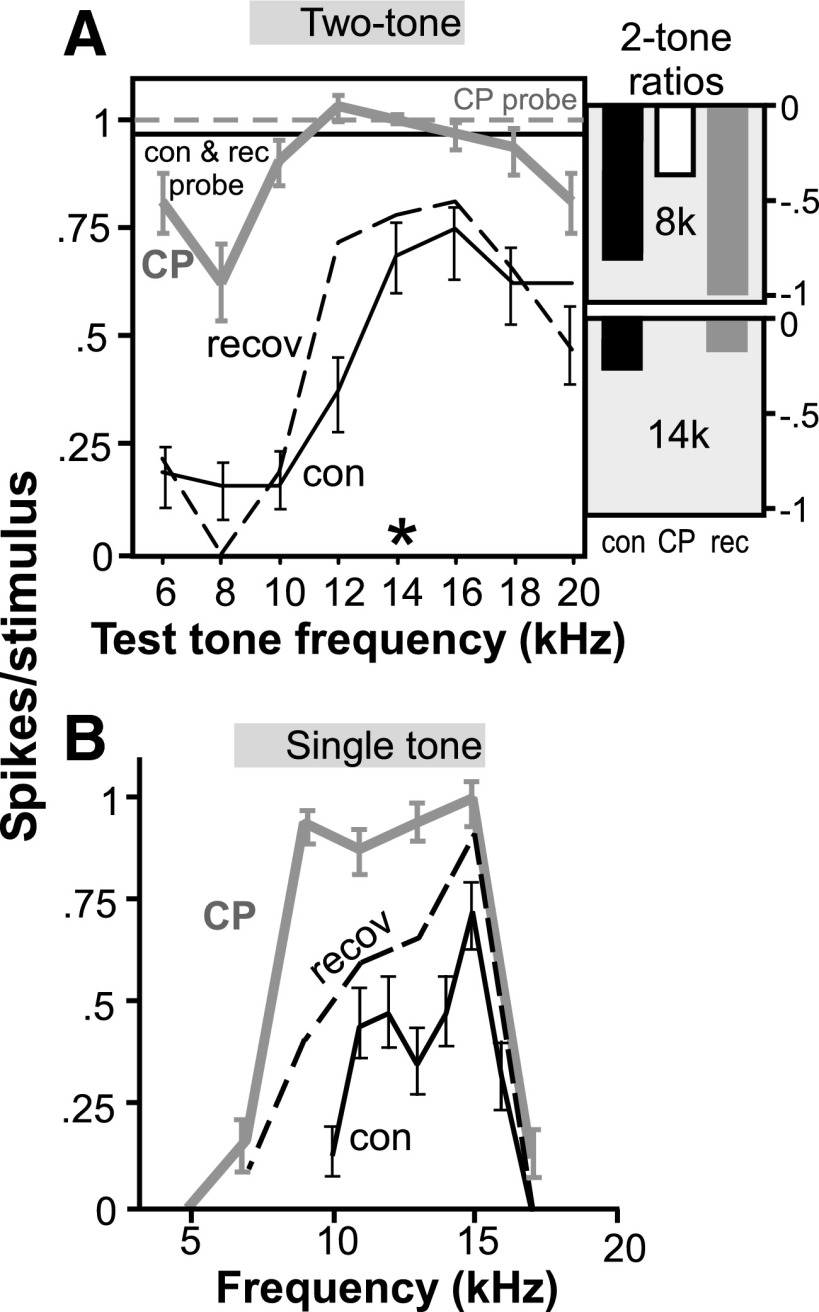
FIG. 4.
Effect of the selective 5-HT1B agonist CP93129 on 2-tone frequency interactions in a neuron that substantially changed in tuning bandwidth. A: 2-tone response curve for a single neuron in the control, CP93129, and recovery. The excitatory probe tone was presented at 14 kHz and 40 dB SPL, and the test tone was presented every 2 kHz from 6 to 20 kHz at 60 dB SPL. Conventions are as in Fig. 3. B: frequency response curve for the same neuron in the control, CP93129, and recovery. Tones were presented every kHz from 10 to 17 kHz in the control and every 2 kHz from 5 to 17 kHz in CP93129 and the recovery, at 60 dB SPL.

