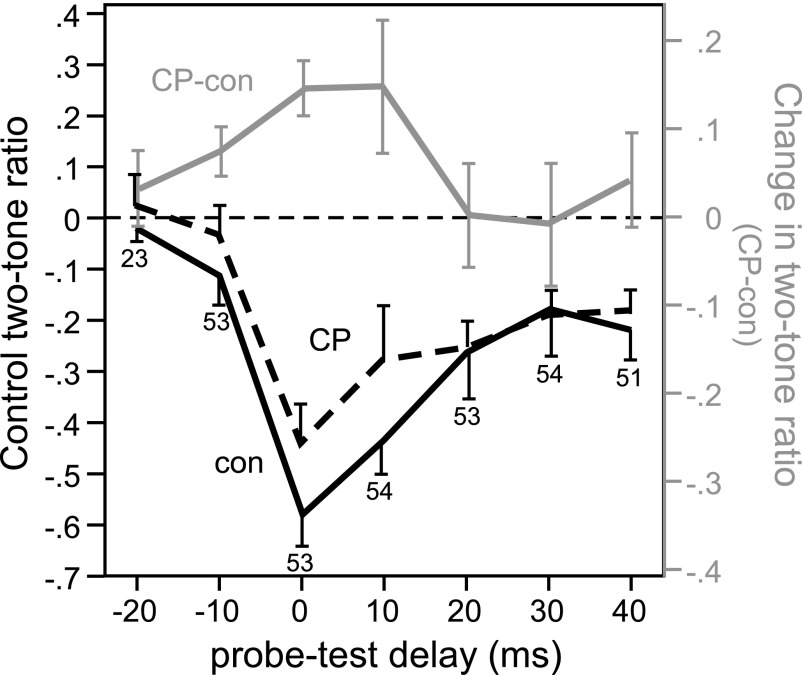
FIG. 6.
Effects of CP93129 on 2-tone reduction of spikes at different probe-test delays. Two-tone ratios are plotted as a function of the delay between the onset of the probe and test tones, from −20 ms (probe tone leading by 20 ms) to +40 ms (probe tone lagging by 40 ms), in both the control (black line, left ordinate; mean − SE, n = 54 neurons) and in the presence of CP93129 (dashed black line, left ordinate; mean + SE). Test tones were presented at the frequency evoking peak reduction of spikes for each neuron. The difference in the 2-tone ratio between the control and drug application in the same set of neurons is plotted in parallel (gray line, right ordinate, mean ± SE, CP93129-control values). Positive values indicate a decrease in the 2-tone reduction of spikes. Numbers at particular probe-test delays indicate how many neurons were recorded at these delays.

