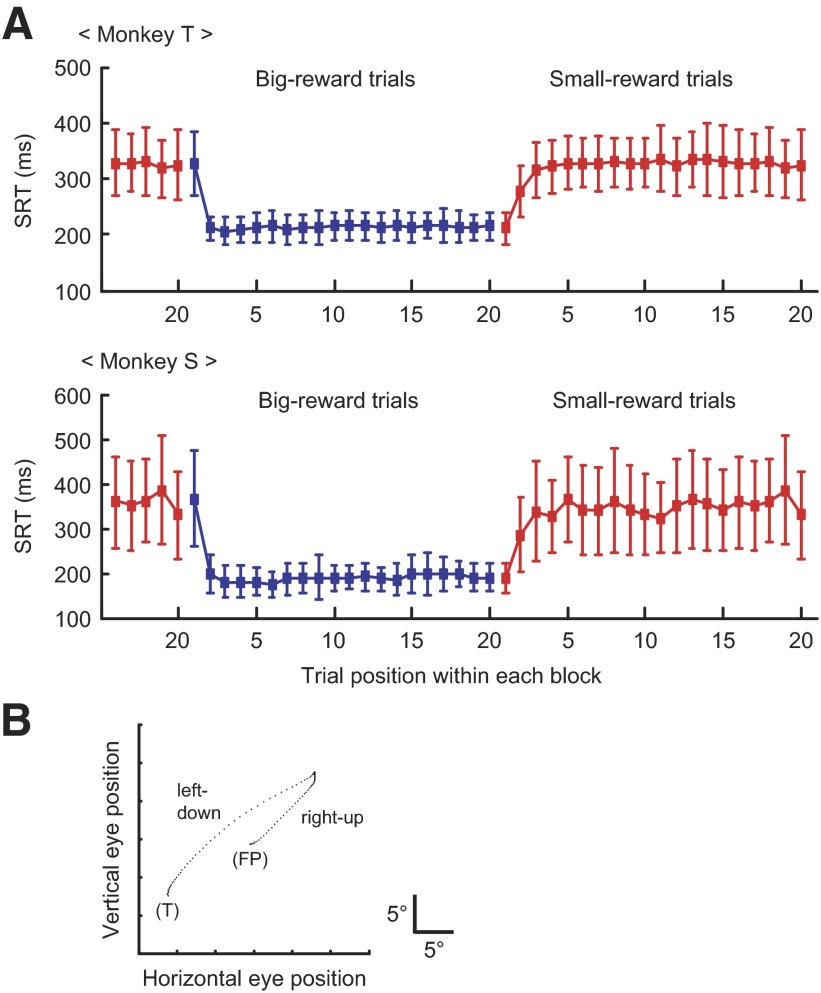
FIG. 3.
Animal performance. A: changes in SRT with changes in the position-reward mapping. The SRT (mean ± 1SD) is plotted as a function of the numerical position of trials in each block for monkey T (top) and monkey S (bottom). Big-reward trials are indicated in blue and small-reward trials in red. Both directions of saccades are combined. B: an example of occasional misdirected saccades observed in small-reward trials (x–y plot of eye position). The monkey first made a saccade in error to the position associated with a big reward (“right-up”) and then changed the saccade direction toward the correct visible target associated with a small reward (“left-down”). FP, fixation point; T, saccade target.

