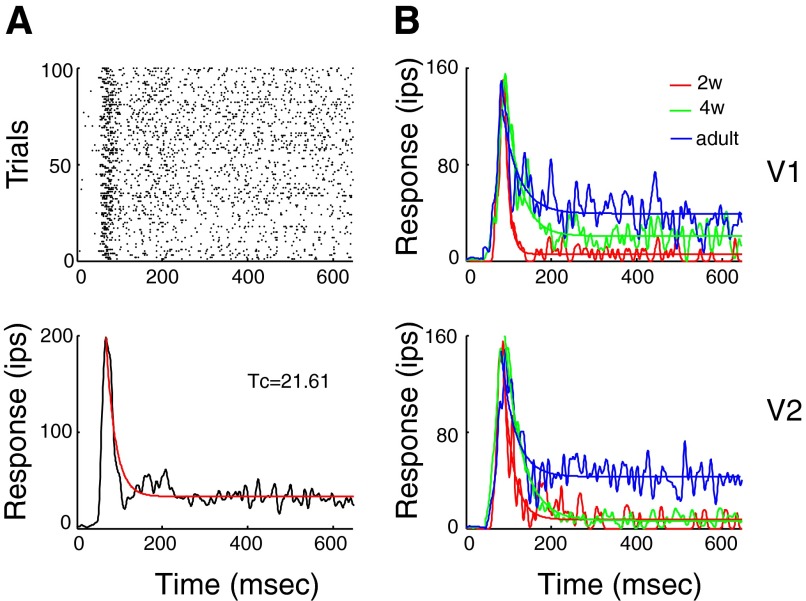
FIG. 1.
Temporal dynamics of responses and developmental changes in firing rates of transient and sustained components of cell's discharge in V1 and V2. A, top: raster plot showing responses of an adult V1 neuron to 640 ms presentation of a high contrast (80%) stationary gratings optimized for orientation/direction, spatial frequency, spatial phase, and size for 100 trials. Bottom: poststimulus time histogram (PSTH) constructed with resolution of 1.0 ms and smoothed by a Gaussian filter with SD of 2.0 ms. Firing rate R was fitted into an exponential decay function (red line). R = (Rmax − Rmin)*exp(−t/tc) + Rmin, where Rmax is the peak firing rate, Rmin is the asymptotic firing rate, tc is the time constant, and t is the time since peak. B: temporal patterns of responses in V1 (top) and V2 (bottom) neurons of 2 (red)- and 4-wk-old-infant (green) and adult (blue) monkeys.

