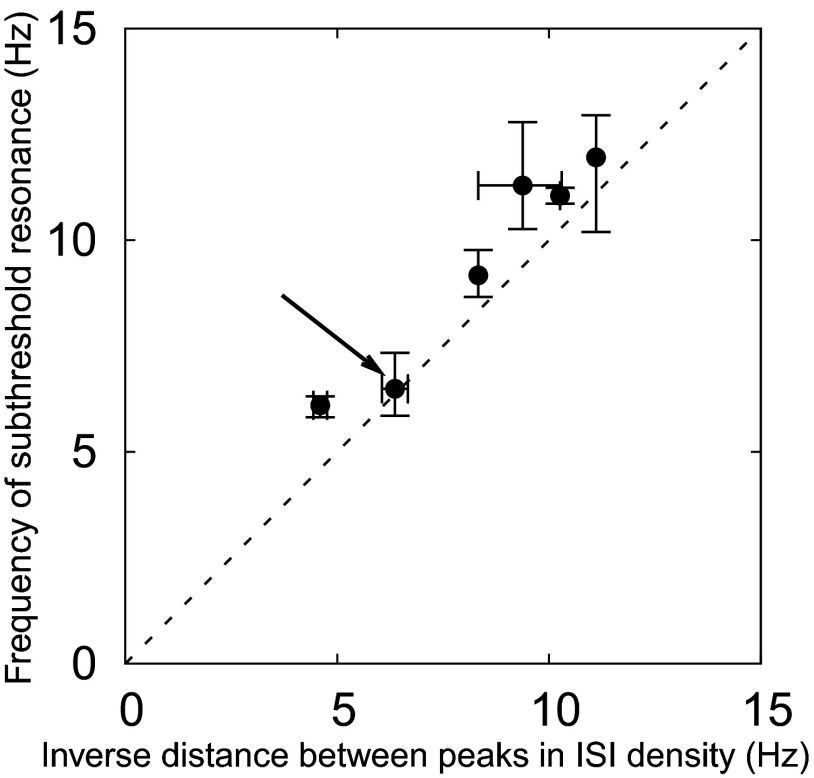
FIG. 8.
Relation between the frequency of subthreshold resonance and the inverse distance between the first and second peaks in the ISI density. Each data point corresponds to a different stellate cell, which are known to have resonances in the frequency range of 5–15 Hz. The horizontal and vertical bars mark the minimal and maximal observed values, as described in detail in methods. The arrow points to the cell presented in Figs. 2–7. Our model framework predicts that for every cell the inverse differences between the two ISI peaks are very similar to the natural oscillation frequency near the firing threshold. This frequency, in turn, has been shown to be close to but smaller than the subthreshold resonance frequency (compare fosc and fres, Eq. 4), as discussed in methods and Erchova et al. (2004). It follows that the resonance frequency should slightly exceed the inverse ISI-peak difference so that the data points should be above but close to the dashed identity line, as confirmed by the population data.

