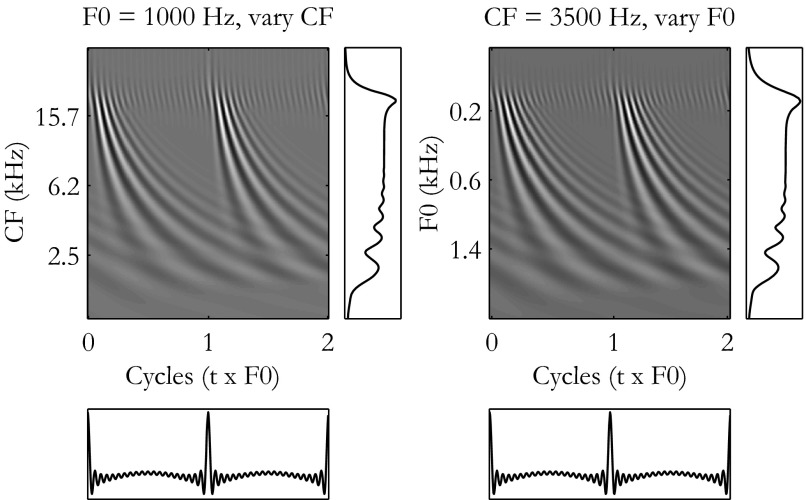
FIG. 1.
Illustration of scaling invariance in cochlear mechanics using a peripheral auditory model. Left: model response of an array of auditory-nerve (AN) fibers with different characteristic frequencies (CFs) to a harmonic complex tone with equal-amplitude harmonics (F0 = 1,000 Hz). Right: model response for one AN fiber (CF = 3,500 Hz) as a function of the F0 of a harmonic complex tone. F0 values were chosen to obtain the same set of normalized frequencies CF/F0 as on the left, so that responses in the 2 panels should be identical if scaling invariance holds. For both panels, gray scale represents the response amplitude, and the timescale is normalized to units of stimulus cycle (t × F0). Bottom panels show the stimulus waveform on the same normalized scale. Small panels on the right of each main panel show the average model firing rate as a function of CF/F0, obtained by summing the spatiotemporal response patterns over one stimulus cycle.

