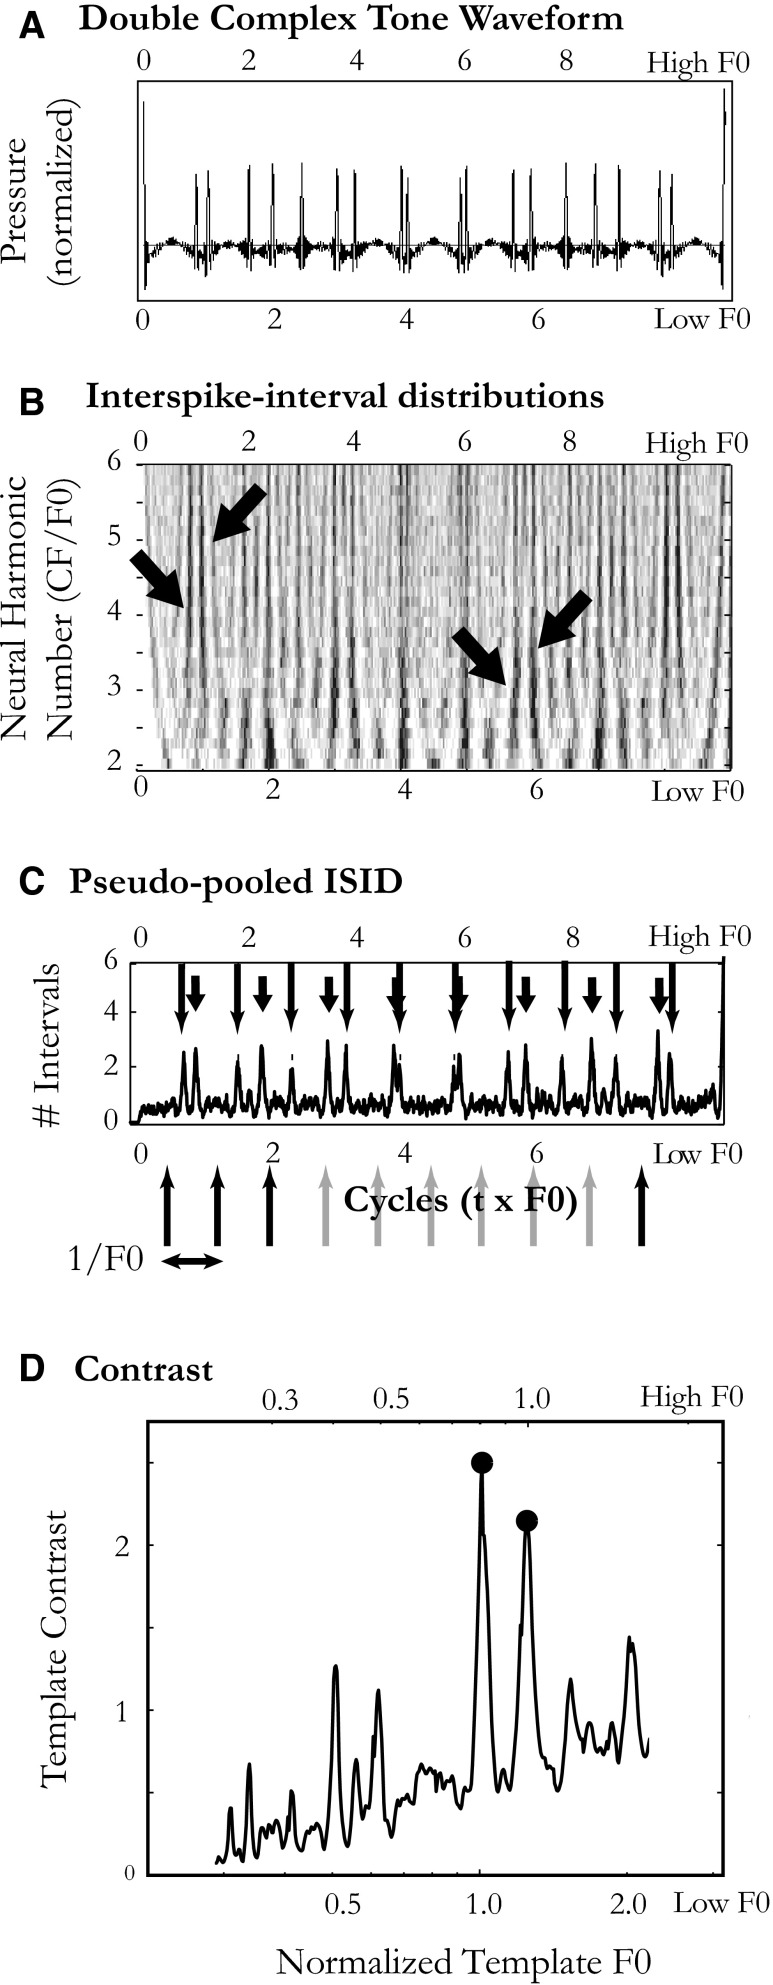
FIG. 5.
Method for estimating the F0s of double complex tones from the interspike-interval distributions (ISIDs) of an AN fiber (CF = 816 Hz). A: one period of the waveform of double complex tone with F0 ratio of 11/9. B: ISIDs measured in response to the double complex tone as a function of probe F0. Gray scale represents the number of intervals in each time bin. ISIDs are plotted on normalized timescales in units of number of cycles of either tone (lower scale on panel: low F0 tone, upper scale on panel: high F0 tone). This scaling leads to vertical ridges in the ISID at the periods of the 2 complex tones and their multiples (block arrows). C: pseudopooled ISIDs obtained by summing the time-normalized ISIDs over all probe F0s. Wide and thin downward arrows show the periods of the lower and the upper tone, respectively. Upward arrows at the bottom point to the time bins at which a periodic template with period 1/F0 tallies interval counts from the pseudopooled ISID. These tallies are then normalized by the mean number of intervals per bin in the pseudopooled ISID to obtain the template contrast, and the operation is repeated for a wide range of template F0s. D: template contrast as a function of normalized template F0 for the pseudopooled ISID in C. The template F0 is normalized to the F0 of the lower tone at the bottom of the panel, and to the F0 of the higher tone at the top of the panel. The F0 estimates for the double tone are the locations of the 2 largest peaks in the contrast function.

