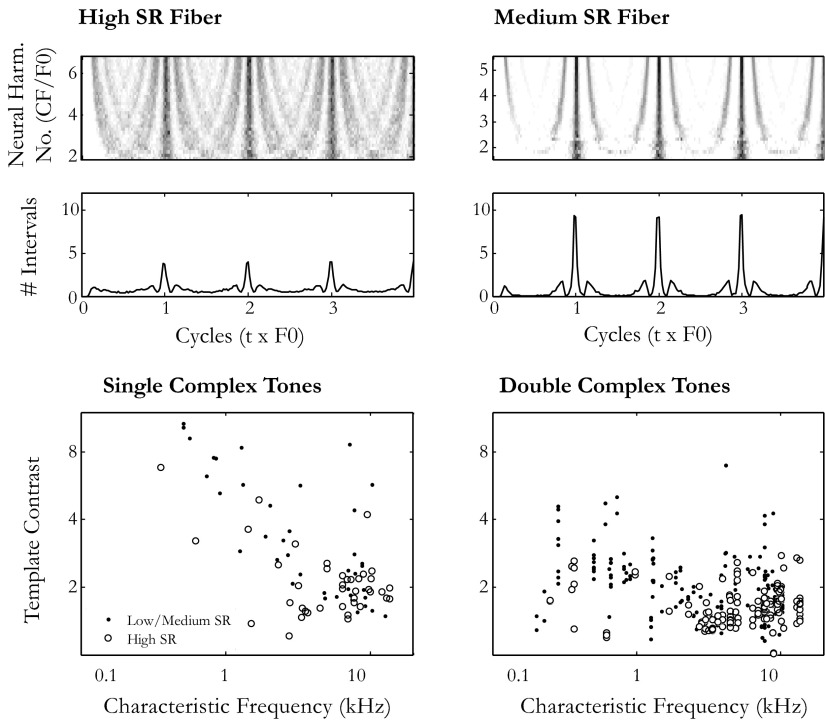
FIG. 9.
Effect of spontaneous rate on neural template contrast (a correlate of pitch strength). A and B: ISID as a function of probe F0 (top) and pseudopooled interval distribution (bottom) in response to a single complex tone for a high-spontaneous discharge rate (SR) fiber (A, 66 spikes/s) and a medium-SR fiber (B, 3 spikes/s). Both fibers have similar thresholds (10–15 dB SPL) and CF (500–600 Hz). C and D: template contrast at the estimated F0 as a function of CF for the AN fiber population in response to single (C) and double complex tones (D). The data shown in D include contrast values for both F0 ratios and both the lower and higher F0s of each double tone.

