
FIG. 6.
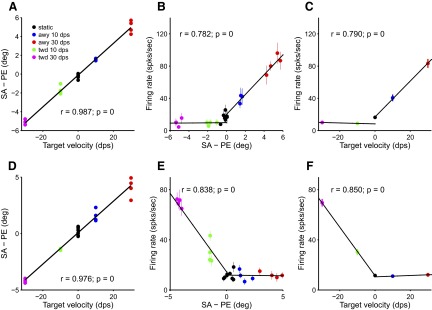
Two example recordings showing dependence of saccade metrics and FR on TV. A: residual (SA − PE) vs. TV. Text gives correlation coefficient (r) and p value (p). B: dependence of FR on residual (SA − PE). Data were fit with a piecewise linear function. Text shows correlation (r, p) between the piecewise linear fit and the data. C: FR vs. TV. Same conventions as B. D, E, and F: same as A, B, and C but for a second neuron/recording session.