
FIG. 8.
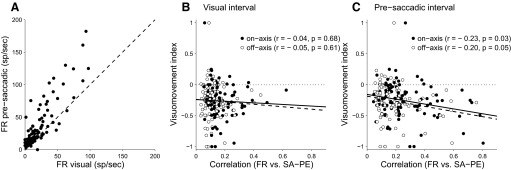
Visuomovement index and TV compensation. A: FR during visual vs. presaccadic trial epoch. These are the rates that were used to compute the visuomotor index for each cell. B: visuomovement index vs. velocity compensation metric (FR vs. SA − PE). FR for velocity compensation was measured during the visual trial epoch. Filled circles and solid regression line are for on-axis motion trials, open circles and dashed line are off-axis trials (thus each cell is represented by 2 data points). Correlation coefficient (r) and significance level (P) are given in the legend. Note that “SA − PE” is valid for on-axis trials and should be replaced by “SD–DE” for off-axis. C: same format as B except that the FR for the velocity compensation metric was taken from the presaccadic trial epoch.