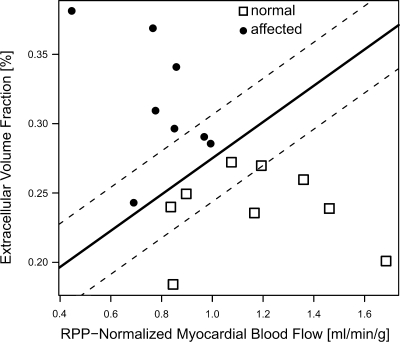
Fig. 5.
The extracellular volume fraction was plotted vs. the RPP-normalized MBF, with IDC diagnosis encoded as solid circles, to determine whether the IDC patients could be separated with these 2 parameters from unaffected participants. A logistic regression model including both extracellular volume fraction and RPP-normalized MBF as independent predictors was used to determine the line corresponding to a probability of P = 0.5 for an IDC diagnosis and drawn as solid line in the graph. It perfectly separated the 2 groups. The dashed lines correspond to probabilities of P = 0.05 and P = 0.95 for IDC diagnosis, respectively.

