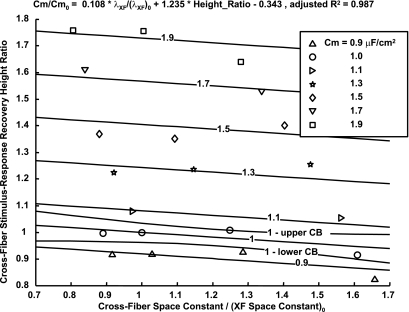
Fig. 5.
A fit to model results so that changes in Cm can be predicted from measured changes in the cross-fiber stimulus-response recovery height and effective λXF, showing contours of constant Cm and simultaneous functional confidence boundaries about the 1 μF/cm2 contour. Cm0, initial Cm; (λXF)0, initial λXF.

